Frequency
Envelope
Amplitude
Rhythm
Filter
Effect
Help
Congratulations, you've made it to the Help section of DataSonifyer! Here, you'll find everything you need to know about the DataSonifyer tool.
You'll find more here: datasonifyer.de
Graphics are for the eyes, sonifications for the ears: With DataSonifyer you can easily turn data sets into sound. A data graphic to listen to, so to speak - for your podcast, your radio show, your radio play, your music or wherever you want to use audio.
The best thing to do is to give it a try. This graph here might look familiar:
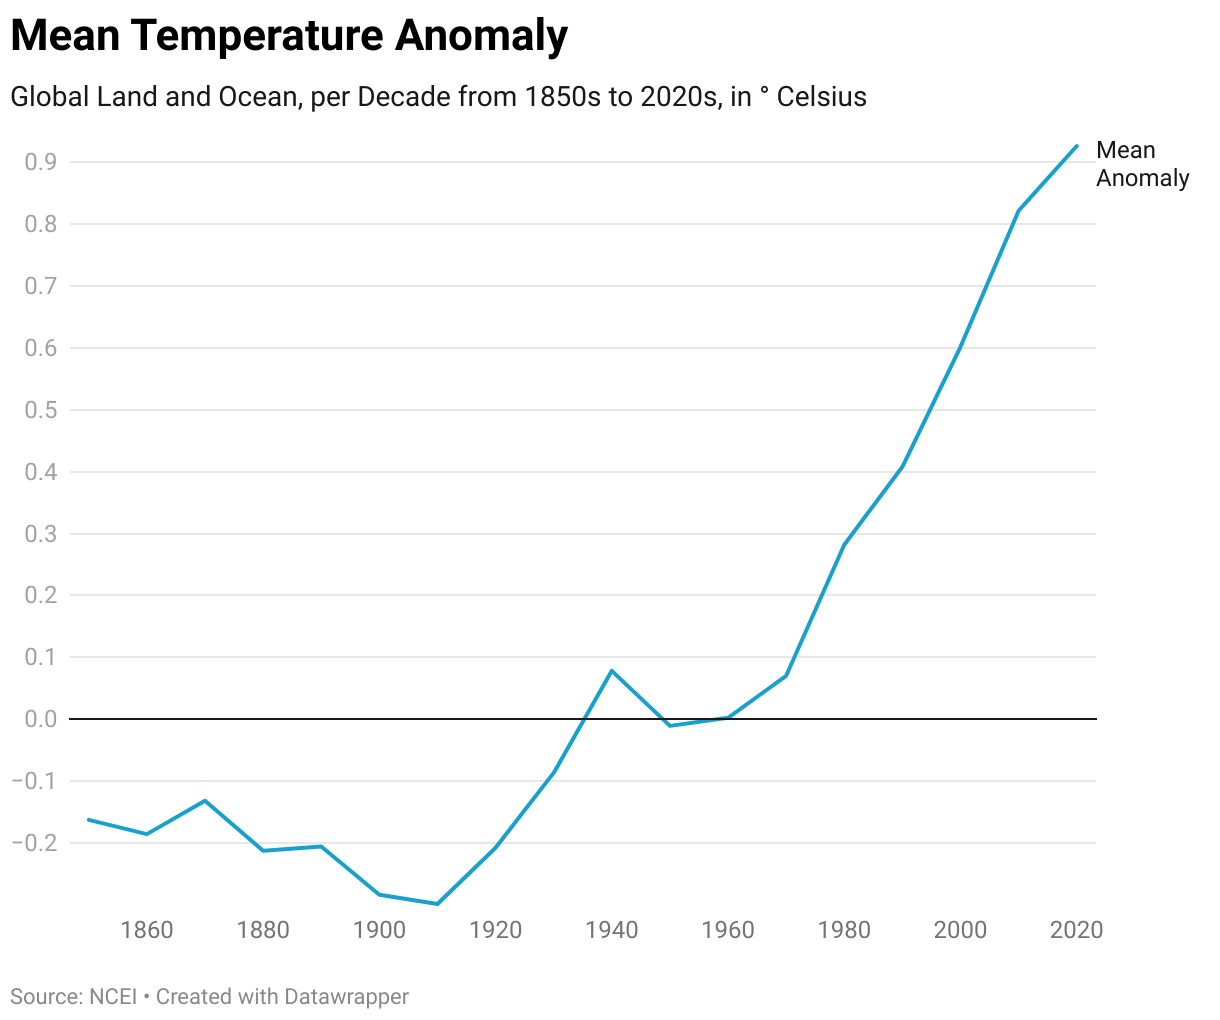
This is the mean deviation of the average temperature per decade from the 20th century average - or global warming for short, a cause of climate change. Visual media can easily use this graph to make the exponential dynamics easier to understand - in auditory media, we can mostly just read out the numbers.
What if we could also listen to the numbers as a melody? Let's try it out! Download the numbers from the graph by clicking on "Get the data" below the graph. Now there should be a CSV file ("Comma Seperated Values") in your download folder.
Now click on "Load Data" in DataSonifyer and select the file. Then click on "Ok". Now a text input appears asking for the separator - simply enter a comma, i.e. "," without quotation marks and click on ok. The data is now loaded into DataSonifyer!
The green canvas in the middle should now say "Decade as pitch" above a slanted line in the top left-hand corner - this is because the data consists of two columns: The decade ("Decade") and the mean temperature anomaly ("Mean Anomaly"). However, we do not want to hear the "Decade", but the "Mean Anomaly".
You can create melodies with the module labeled "Frequency" - i.e. pitch or tone frequency. Click on the drop-down next to "Data" and select "Mean Anomaly". Now the visualisation has changed - you see an illustration of the curve that is also shown on the graph above! Now select a key under "Scalemode", e.g. "C minor". In the fields below, set the octave a little higher by entering 3 for "Min Oct" and 5 for "Max Oct".
Now click on "Play" at the top right. Congratulations, your first sonification! You can play it faster or slower by increasing or decreasing the "BPM" value. Set it to 240 and click on "Play" again - it has now become faster!
If you don't want it to start again from the beginning at the end, set "Loop" to "Off" in the selection to the right of the BPM.
You can now use this sonification for your podcast or audio product to present the dynamics of climate change in a different way. Now click on "Record" - the DataSonifyer is now ready to record the sonification. Start it again with "Play" and let it play as long as you want. Then click on "Stop", then again on the "Record" button. If you now scroll down, a field appears with the title "Your Recordings". Here you can download the sonification by clicking on "Download as WAV" - done.
Try changing the sound by selecting a different sound source in the drop-down next to "Sound". If the tone sounds a bit too sharp now, click on the "Add Sound Modules" button at the bottom left and select "Filter Control". Click on "Save". Now a new sound module appears with the label "Filter". Select "Lowpass Filter" under "Type" and set the filter frequency to 100 under "Custom". Experiment a little with the values and with different sounds.
With each sound module you can edit other musical values - either as in this example in the "Frequency" module with your uploaded data or as in the "Filter" module with your manual inputs.
The DataSonifyer allows you to display your data as pitch ("Frequency"), as volume ("Amplitude"), as tone length or tone shape ("Envelope"), as rhythm ("Rhythm"), as "Filter" or as "Effect". For each of these musical values, DataSonifyer has its own module, in which you can also make manual entries.
Just experiment a bit - instructions for each module are available here. How would it sound, for example, if you turn the temperature increase into volume and use a randomly generated melody in the Frequency module?
DataSonifyer is a tool that allows you to turn data sets - numbers - into sound: This is called data sonification. You can load data sets with the "Load Data" button. With the "Play", "Stop" and "Record" buttons you can play, stop or record your sounds.
The large green canvas in the middle displays your data as a chart - at the start, it only shows default sounds: They are for the soundcheck - you can play these a test by hitting "Play".
In the fields below the visualisation you can adjust how your sonification should sound and how fast the sonification should be playing.
Below that you find the sound modules: They are the most important instruments in DataSonifyer. They let you choose which of your data you want to display as a sound, as pitch, volume or rhythm.
Below you find three more buttons: With "Add Sound Modules" you can load further sound modules. With "Export Preset" and "Import Preset" you can export your current work or load presets.
As soon as you have recorded a sonification, another green field appears with your recorded sonifications. You can download your sounds from there.
Sonification is the process of representing numbers or numerical datasets as sound. The principle is simple: you reconfigure the data in a way that makes it musically legible and playable, such as translating it into pitch, note value, volume, tempo, or note duration. The dataset is essentially transformed into a musical score: the DataSonifyer converts your numbers into sheet music and plays it back. This allows you to listen to your datasets.
DataSonifyer enables you to portray your data as pitch ('Frequency'), volume ('Amplitude'), tone length or shape ('Envelope'), rhythm ('Rhythm'), 'Filters,' or 'Effects.' DataSonifyer has a dedicated module for each of these musical parameters.
The most crucial step in sonification is normalization. This is the process by which selected numbers are converted into the corresponding musical values, creating the 'musical score' for sonification. In essence, it works like this: a low data value of 0, for example, may be represented as the note C, while a high data value of 100 might correspond to the note B. All other numbers between 0 and 100 should accordingly fall between C and B. This way, datasets can be made audible as melodies.
However, not all datasets contain numbers between 0 and 100. For instance, temperature data from a summer weather report can range from 0 to 40 degrees Celsius, while COVID-19 data can span from 0 to several hundred thousand cases. Therefore, different minimum and maximum values must be specified for each dataset to ensure that the conversion, whether it's into musical notes from C to B or volume levels from 0 (quiet) to 1 (loud), works correctly.
This is where normalization comes into play: it adjusts the data you've loaded so that it fits within the musical values. This means that the maximum value in your data aligns with the maximum musical value, and the minimum value corresponds to the minimum musical value. The relationship between the original data points remains unchanged – only the scale is adapted.
DataSonifyer takes care of normalization for you: you simply load your data into the tool and specify the musical range your data should fall within. DataSonifyer automatically detects the minimum and maximum values within your own data and then converts them into the desired musical values. However, you can also manually set the minimum and maximum values of your datasets at any time. For example, it sometimes makes sense to set your own values, such as for percentages that always range between 0 and 100.
DataSonifyer only stores all data locally in your browser. The advantage: this tool is highly privacy-friendly. The drawback: once you reload the DataSonifyer, everything you previously worked on will be lost.
However, you can preserve your work with a single click on 'Export Preset' at the bottom of the window. Now, a JSON file containing your work status will appear in your download folder. The next time you click on 'Import Preset,' you can load this file into the DataSonifyer and continue sonifying from where you left off.
By the way, these files can be loaded into the DataSonifyer by anyone. If you want to share your sonification with others, you can easily send this JSON file, and others can load it in their browsers using the DataSonifyer and listen to your sonification.
You can load all datasets composed of numbers into the DataSonifyer. However, they should be in tabular form, with columns and rows. For example, a dataset could consist of columns like 'temperature' and 'year,' with each row containing the temperature and the corresponding year. Ideally, the dataset should not exceed 100 rows: the larger the dataset, the more complex the conversion to sound – with overly large datasets, the tool may slow down, and crackling noises may occur.
The accepted format is 'CSV,' which stands for 'comma-separated values.' You can create this format by going to Excel, clicking on 'File,' then 'Export,' and choosing 'Change File Type,' and finally selecting 'CSV (comma-separated).' It's important to remember the delimiter. In most cases, it's a comma (,), but in some instances – as in the German version of Excel – it might be a semicolon (;).
Now, in the DataSonifyer, click on 'Load Data.' A window will open where you can choose your CSV file. Select your file and click 'Open.' Another window will then appear, asking for the delimiter. Enter the appropriate delimiter (',' or ';') without the quotation marks into the text field and click 'OK.'
Once the data has been successfully loaded, the first column of your dataset will be displayed in the visualization. Additionally, the columns of your dataset should be accessible under 'Data' in each sound module: the dropdown menu will display the headers of the respective columns. It's best to check in the pitch sound module to ensure that the desired data has been loaded – here, the first column of the dataset is automatically selected and visualized.
The data is displayed in the visualization as you would typically see in visualizations: one box per data point, with the height of the box corresponding to the data value.
If only 'Custom' is available as an option besides 'Custom,' the data may not have been loaded correctly. The following checklist can help you troubleshoot:
- Correct Delimiter? Check if you have entered the correct delimiter. To do this, you can open the CSV file in a text editor (right-click => Open with => Editor). Now you will see the raw data: instead of columns, the data is separated by a delimiter in each row. Copy the delimiter and close the file without saving it. Now try to load the data again. Paste the copied delimiter into the text field that asks for the delimiter when loading the data.
- Numeric Data Only? Check if your dataset indeed contains only numbers. The DataSonifyer ignores columns with other values, such as letters or characters. It can handle all types of numbers, including positive and negative, decimals, and integers. Make sure that each column contains only numeric data and doesn't include dates (Excel often automatically converts numbers into date formats), accidental letters, or special characters. Try loading the data again.
- Too Much Data? The larger the dataset, the smaller the individual boxes in the visualization become to display all data points. When loading very large datasets, the boxes in the visualization may become hard to see. Try loading a different dataset or one with fewer data points.
- Is DataSonifyer Working? In this first version of the DataSonifyer, errors can still occur. If you have entered the correct delimiter and have only numeric data, but the data still won't load, try reloading the DataSonifyer or opening it in a different browser. If it still doesn't work, please send an email to info[at]datasonifyer[dot]de with a description of the problem. It's best to include your data or describe the data you're trying to load into the DataSonifyer.
At the top right, you have three buttons that work like in any music programme: Click on "Play" to listen to your sonification and on "Stop" to pause the sound.
If you want to record your sonification, click on "Record". The button will now show "Record", indicating that the DataSonifyer is ready to record. Then click on "Play" and the DataSonifyer will record what is played. When the sonification has finished playing or when you click "Stop", press the "Record" button again. Your recordings are now displayed at the bottom of the page. Here you can listen to them again or click on "Download as WAV" to download them as WAV files. You can edit these files further, for example with Audacity.
If this happens to you, you've either created a very interesting sonification, or your browser is currently struggling with the computational tasks it needs to handle. You might also hear crackling and noise in such situations.
But don't worry, you can take the following steps:
- Save your progress by clicking on 'Export Preset.' Then, reload the DataSonifyer and import your progress by clicking on 'Import Preset.' Choose the file you just downloaded (it's a JSON file) and click 'OK.' Your progress should now reappear. When you click 'Play' again, the crackling and noise should ideally be gone.
- If this doesn't help, try closing all other browser windows and then reloading the DataSonifyer (along with your progress, the JSON file).
- If that still doesn't work, it's possible that your dataset is too large, or the sonification is too complex (e.g., too many modules at once). DataSonifyer is designed for beginners and may not handle overly complex sonifications well. For instance, the tool can only process ten tones and ten effects in parallel. In most cases, this isn't an issue, but if you need to process many tones with effects rapidly, the DataSonifyer may struggle. In such cases, consider whether you can sonify your dataset with fewer data points (e.g., by aggregating data). If that doesn't help either, you might want to explore alternatives, such as using the 'Sonic Pi' tool, which allows you to sonify larger datasets, but requires some knowledge of coding.
While the DataSonifyer is primarily a sound tool, the visualization (the green canvas) still provides you with an idea of how your data looks. Once you have successfully loaded a dataset, the first column of the dataset is automatically selected and visualized in the 'Frequency' module. The data is presented in a familiar visualization style: one box per data point, with the height of the box corresponding to the data value. The volume is represented by the transparency of the boxes: the more transparent a box, the quieter the corresponding data point. The length of the sound, or the 'Envelope,' is depicted by the length of the boxes. When you click 'Play,' the currently played data point is always highlighted in red.
Below the visualization, you'll find four general settings options: Sound, BPM, Loop, and Shuffle.
-
Sound: Under 'Sound,' you can choose how you want your sonification to sound. You have various synthesizers at your disposal, as well as a noise generator. Feel free to experiment with which sound best suits your sonification. You can adjust the sound, for instance, making it softer or more brilliant with filters. You control the pitch of the sound in the 'Frequency' sound module. With the noise generator, you can create many other sounds yourself by using the Envelope module to create short or long sounds and shaping them with filters to match your data.
-
BPM: Under 'BPM,' you select the playback speed of your sonification. 'BPM' stands for Beats Per Minute, indicating the number of tones to be played per minute. A BPM value of 60 means that 60 tones will be played per minute, or one tone per second. A BPM value of 120 means that 120 tones will be played per minute, or two tones per second. The higher the BPM value, the faster your sonification will play. The BPM value also affects your inputs in the Rhythm module.
-
Loop: In the 'Loop' field, you can choose whether your sonification should play only once (Loop: 'Off') or if it should be repeated continuously (Loop: 'On').
-
Shuffle: In the 'Shuffle' field, you can decide whether you want to shuffle your data series like a deck of cards. You can do this either just for fun or to sonify distributions along with the Rhythm module
You have the flexibility to decide how you want to make your data audible: Do you want your data to be heard as pitch? Or as volume? Or as rhythm?
For each musical value, the DataSonifyer provides a dedicated module: pitch ('Frequency'), volume ('Amplitude'), 'Envelope' (the length or outer shape of the sound), 'Rhythm' (the note values, i.e., the time interval between the notes). Additionally, there are two more modules that allow you to create more exciting sounds: Filters and Effects.
You can activate or deactivate as many modules as you like by clicking on 'Add Sound Modules' at the bottom left. A window will open, offering various modules to choose from. Select the desired modules and click 'Save.' Important: If you deselect a sound module, it won't be automatically deactivated but rather "hidden." However, you can deactivate it by, for example, entering a "Custom" value or selecting "Off" (in the 'Filter,' 'Envelope,' and 'Effect' modules).
In each module, you can specify whether and which column of your dataset should be converted into the musical value. You can also specify between which musical minimum and maximum values your data should move. Furthermore, you can manually determine what the minimum and maximum values of your own data should be if you don't want to use the automatically detected minimum and maximum.
The Frequency module allows you to represent your datasets as pitch or tone frequency. You can use your selected data columns to control the pitch or frequency of the sounds, for example, representing the increasing global average temperature as a rising sound.
(Note: For the 'Noise' sound, pitch cannot be adjusted. It's best to control the sound of 'Noise' using a filter.)
The Pitch module consists of seven input fields:
- Data: In this field, you choose which data columns you want to use to control the pitch. Initially, only 'Custom' is available here: In this mode, the DataSonifyer will only play the pitch entered in the 'Custom' field or, if the DataSonifyer has just been loaded, a pre-set demo melody. Once you have successfully loaded data into the DataSonifyer, the various columns of your dataset will be available for selection in the 'Data' field. By clicking on the desired data column, you specify which of your data should control the pitch. Once you have selected the corresponding data column, the data points will be displayed in the visualization: Each box represents a data point, and the higher the box, the higher the data value. You can also choose the 'Random' option: The DataSonifyer will generate a randomly generated melody based on your other inputs in the 'Scalemode,' 'Min Freq / Min Oct,' and 'Max Freq / Max Oct' fields. The length of this melody will be the same as your dataset.
- Scalemode: Pitch can be represented differently: as an exact Hertz frequency (the number of oscillations per second) or as a musical scale (C Major, C Minor, Chromatic, etc.). In the 'Scalemode' field, you can choose whether your selected data columns should be converted into exact Hertz frequency (Scalemode: 'Off') or into a musical scale (Scalemode: 'Chromatic,' 'C Major,' etc.).
The 'Chromatic' scale includes all notes: C, C#, D, D#, E, F, F#, G, G#, A, A#, B – across up to five octaves (from a very low C to a quite high B). Other scales like 'C Major' or 'C Minor' each contain the notes of the respective major or minor scale within up to five octaves. Your selected data will be converted so that each data point, based on its 'height,' corresponds to a note in the selected scale within the octaves you specify.
Choosing a scale gives your sonification a certain mood because each scale has a different effect on people. For example, minor scales are perceived as sadder than major scales.
Of course, a note like 'A' can also be represented as a Hertz frequency (A = 440 Hertz). The human ear can perceive a maximum range of 20 to 20,000 Hertz. Between 20 and 20,000 Hertz, all the notes belonging to a scale are found, as well as all the pitches in between. If you convert your data into Hertz frequencies, they will be translated much more accurately, as you have infinitely more notes to choose from. However, this may sound unusual to many ears since people are accustomed to standard scales in music. If you wish to use a specific pitch, you can refer to this conversion table.
- Min Freq / Min Oct: In this field, you choose how low the pitch should be at a maximum. Depending on whether you have chosen 'Scalemode Off' or one of the musical scales, you can either enter the lowest frequency in Hertz ('Min Freq' values from 20 to 20,000) or the lowest octave of your selected scale ('Min Oct' values from 1 to 5).
- Max Freq / Max Oct: In this field, you choose how high the pitch should be at a maximum. Depending on whether you have chosen 'Scalemode Off' or one of the musical scales, you can either enter the highest frequency in Hertz ('Max Freq' values from 20 to 20,000) or the highest octave of your selected scale ('Max Oct' values from 1 to 5).
- Min Data: After selecting a data column in 'Data,' the lowest value of your data column will be displayed here. This is the value that will represent the lowest pitch ('Min Freq / Min Oct'). However, you can also set a different value that is lower than the lowest value in your data column.
- Max Data: After selecting a data column in 'Data,' the highest value of your data column will be displayed here. This is the value that will represent the highest pitch ('Max Freq / Max Oct'). However, you can also set a different value that is higher than the highest value in your data column.
- Custom: If you don't want to represent your data as pitch (for example, if you want to use it as volume), you can enter a custom value here that will be the pitch for all data points. You can set all values in Hertz here.
This module lets you turn your datasets into audible volume variations, known as amplitude. Put simply, it allows you to link higher data values to louder sounds, offering a way to audibly convey data like noise pollution levels in different cities. However, you can use this module to sonify nearly any dataset based on volume.
The Amplitude module assigns specific volume levels to individual data points based on their corresponding values. This module comprises six input fields:
- Data: In this field, you choose which data columns should control the volume changes. Initially, only 'Custom' is available as an option. In this mode, the DataSonifyer will play sounds at a volume level entered in the 'Custom' field. Once you've successfully loaded data into the DataSonifyer, you'll find various columns from your dataset listed in the 'Data' field. By clicking on your desired data column, you specify which of your dataset's columns should control the volume. The conversion process relies on normalization. Visualization conveys volume through the transparency of boxes: The more visible a box, the higher the corresponding data point's value, and the louder the sound.
- Min Amp: In this field, you establish the minimum volume level for your sonification. Volume is quantified on a scale from 0.0 (completely silent) to 1.0 (maximum loudness).
- Max Amp: Here, you set the maximum volume level for your sonification. Volume is quantified on a scale from 0.0 (completely silent) to 1.0 (maximum loudness).
- Min Data: After selecting a data column in the 'Data' field, the lowest value from your chosen data column is displayed here. This value corresponds to the lowest volume level ('Min Amp') in the sonification. However, you have the option to specify a different value that falls below the lowest value in your data column.
- Max Data: After selecting a data column in the 'Data' field, the highest value from your chosen data column is displayed here. This value corresponds to the maximum volume level ('Max Amp') in the sonification. Nevertheless, you can also set a different value that exceeds the highest value in your data column.
- Custom: If you prefer not to represent your data as volume (for example, if you intend to use it for pitch modulation), you can set a consistent volume level here, applying it uniformly across the entire sonification. You can assign values ranging from 0.0 to 1.0 in this field.
In this module, you have the power to shape the outer form of your sound using the data series you've loaded. Do you want a brief sound, a gentle, gradually intensifying one like a stringed instrument, or perhaps varying in length based on data values? The technical term for the outer shape of sound is "envelope". Think of it as the external structure encapsulating your sound.
With this module, you could, for instance, represent quantities: the larger the quantity (like CO2 levels), the longer the sound. However, you can also use any dataset to represent sound duration.
In this module, you have two options for altering sound duration: either you can modify the total duration of the sound in seconds ("Duration"), determining how long each sound should be in total, or you can specify how many seconds it should take for the sound to reach its full volume ("Attack"). The temporal spacing between individual sounds is controlled separately in the "Rhythm" module.
The Envelope module consists of seven input fields:
- Data: In this field, you select which data columns should control the sound's outer form. Initially, only 'Custom' is available as an option. Unless you choose 'Off' under "Type," the DataSonifyer will play sounds in this mode with the duration you enter in the 'Custom' field. Once you've successfully loaded data into the DataSonifyer, you'll find various columns from your dataset listed in the 'Data' field. By clicking on your desired data column, you specify which of your dataset's columns should control the sound's outer form. The conversion process relies on normalization. The "envelope" is represented in the visualization by the length of boxes: the longer the box, the higher a data point, and the longer the "Duration" or "Attack" of the sound.
- Type: Here, you can select the type of sound envelope you want to control with this module. With "Duration," you can determine how many seconds a sound should last before it becomes quiet again. With "Attack," you can specify how many seconds it should take for the sound to reach its full volume. You can control either "Duration" or "Attack," not both at the same time.
- Min Env: In this field, you set the minimum number of seconds into which your data should be converted. If you've chosen "Attack" as the Type, this represents the minimum number of seconds it takes for the sound to reach its full volume. If you've selected "Duration," this represents the minimum number of seconds the sound should play at full volume. Values can range from 0.001 to 4 seconds.
- Max Env: Here, you set the maximum number of seconds into which your data should be converted. If you've chosen "Attack" as the Type, this represents the maximum number of seconds it takes for the sound to reach its full volume. If you've selected "Duration," this represents the maximum number of seconds the sound should play at full volume. Values can range from 0.001 to 4 seconds.
- Min Data: After selecting a data column in the 'Data' field, the lowest value from your chosen data column is displayed here. This value corresponds to the shortest duration ("Min Env") in the sonification. However, you have the option to specify a different value that falls below the lowest value in your data column.
- Max Data: After selecting a data column in the 'Data' field, the highest value from your chosen data column is displayed here. This value corresponds to the longest duration ("Max Env") in the sonification. Nevertheless, you can also set a different value that exceeds the highest value in your data column.
- Custom: If you prefer not to represent your data as sound duration (for instance, if you intend to use it for volume modulation), you can set a duration in seconds for "Duration" or "Attack" here, applying it uniformly across the entire sonification. You can assign values between 0.001 and 4.0 seconds in this field.
*Note: Since the DataSonifyer can play a maximum of 10 sounds simultaneously, this may affect the maximum number of seconds the sound is actually played. For example, if 10 different sounds are played within two seconds, the maximum duration is limited to 2 seconds, even if you selected "4". Therefore, it's advisable to work with smaller values for fast sonifications – those with high BPM or a rapid rhythm.
If you've ever driven a car, you might be familiar with the beeping sound that some cars make when you're parking in reverse. The faster the beeping, the closer you are to an obstacle. Similarly, think of a Geiger counter: the shorter the time between the clicks, the higher the radiation level. These types of auditory representations can be created using the Rhythm module.
With this module, you can generate simple or complex rhythms for your sonifications. It's suitable for sonifications that aim to represent intervals or changing quantities.
The Rhythm module controls the temporal gap between individual sounds, known as beats. This results in either a faster or slower rhythm, depending on the data values.
The rhythm is represented in beats. The time between beats, known as beat length, is determined by the BPM (Beats Per Minute) you input. For example, at 60 BPM, it takes exactly one second from one beat to the next. If you increase BPM to 120, the gap between beats becomes half a second. Conversely, if you lower BPM to 30, it becomes 2 seconds. The formula is as follows: Gap between beats = Beats per Minute divided by 60 seconds.
The gap between beats does not affect the sound's duration, only the distance between one sound and the next. For example, if your sound has a "Duration" of 1 second but the beat length is set to 0.5 seconds (at 60 BPM), the sound will overlap with the next sound by 0.5 seconds.
Here are the seven different fields you can use:
- Data: In the "Data" field, you can select which data columns should control the gap between beats. Initially, only 'Custom' is available as an option. If no data has been loaded yet, the DataSonifyer will use the value entered in "Custom." A higher value here leads to a faster rhythm. Once you've successfully loaded data into the DataSonifyer, various columns from your dataset will be available in the 'Data' field. By clicking on your desired data column, you specify which of your dataset's columns should control the gap between beats.
- Rhythm: Here, you set the mode of your rhythm sonification, i.e., how the data should be converted. It's best to read through the other input fields first. The six different modes are explained below.
- Min Rhy: You determine the minimum gap between beats in this field. For example, a "Min Rhy" of 0.25 means that the gap between sounds can be a minimum of a quarter of a full beat length, which is 1 * 0.25. Accordingly, 0.5 represents half a beat length, and so on.
- Max Rhy: You specify the maximum gap between beats in this field. A "Max Rhy" of 1.0, for instance, means that the gap between sounds should be a maximum of one full beat length.
- Min Data: After selecting a data column in the 'Data' field, the lowest value from your chosen data column is displayed here. This value corresponds to the shortest gap between beats ("Min Rhy"). However, you have the option to specify a different value that falls below the lowest value in your data column.
- Max Data: After selecting a data column in the 'Data' field, the highest value from your chosen data column is displayed here. This value corresponds to the longest gap between beats ("Max Rhy"). Nevertheless, you can set a different value that exceeds the highest value in your data column.
The Rhythm module provides six modes for controlling the rhythm of your sonification and the beats. You can select them in the "Rhythm" field:
- Follow Data: In this mode, the data you've chosen is converted into a temporal gap between beats, ranging between the minimum and maximum beat lengths ("Min Rhy" and "Max Rhy"). This means that the gap between sounds varies from tone to tone, depending on the data value, always within the specified range of beat lengths.
- Follow Data Rhythmically: This mode operates similarly to "Follow Data." The difference is that your data is not converted into the exact value within the minimum and maximum beat lengths but is rounded to correspond to the note values known from music: a whole note (1 beat), half note (0.5 beats), quarter note (0.25 beats), eighth note (0.125 beats), sixteenth note (0.0375 beats), and so on. This means that the gap between sounds still varies based on data values but adheres to specific note values.
- Spread Notes by Data: In this mode, your sounds are duplicated and assigned a specific beat length based on the data value. The temporal gap between sounds and the data value does not change automatically from tone to tone but only after a certain number of beats. You can select this number of beats under "Beat Dur." For example, if you choose 2 beats here, the data value and, consequently, the beat length and sound only change after every two beats. In the meantime, sounds with beat lengths corresponding to their data values are repeated until the total beat length of two beats is reached. For example, if you have a data series consisting of values 1, 4, and 2, with a "Min Rhy" of 0.25 and a "Max Rhy" of 1.0, and a "Beat Dur" of 1 is set, then the minimal data value of 1 would be converted to the minimum beat length of 0.25 beats, the maximum data value of 4 to the maximum beat length of 1 beat, and the data value of 2 to a beat length of 0.5 beats. In this mode, the data series would be played as follows: A total of four sounds with a 0.25 beat gap are played, followed by one sound with a 1-beat gap. Then, two sounds with a 0.5 beat gap are played for a full beat. This mode allows for sonifications where higher data values are heard as faster rhythms and lower data values as slower rhythms. However, the gap between data values is always as long as specified in "Beat Dur." The data value influences the beat length of sounds within the "Beat Dur" time frame.
- Spread Notes by Data Rhythmically: This mode works similarly to "Spread Notes by Data." The difference is that your data within the "Beat Dur" time window is not converted into the exact value within the minimum and maximum beat lengths but is rounded to correspond to note values known from music: a whole note (1 beat), half note (0.5 beats), quarter note (0.25 beats), eighth note (0.125 beats), sixteenth note (0.0375 beats), and so on.
- Spread Notes at Custom Note Value: In this mode, your sounds are duplicated based on data values and assigned a fixed beat length, "Beat Dur." This mode does not create varying beat lengths but duplicates sounds according to their respective data values. The duration of the entire sonification equals one beat (the sonification's length depends on the BPM). Essentially, with a "Beat Dur" of 0.1, the entire sonification is divided into as many slots, each with a beat length of 0.1, as can fit within one beat. This means ten free slots with a beat length of 0.1 beats. The sounds are distributed across these ten slots according to the data values. For example, a data series consisting of values 1, 3, and 6 would first be converted into their relative values to the sum of the series: 1 corresponds to 10%, 3 corresponds to 30%, and 6 corresponds to 60%. The ten slots would then be distributed based on these percentages: the data value of 1 would get one slot, the data value of 3 would get three slots, and the data value of 6 would get six slots, each with a beat length of 0.1 beats. This mode is helpful for sonifications that aim to make distributions audible, such as a dataset representing the speaking time of women and men in parliament. For instance, in the Pitch module, you could specify that women are represented with a pitch of 220 Hertz and men with a pitch of 440 Hertz. In the Rhythm module, you could then select this mode to distribute the beat slots according to the speaking time. Afterward, you could click on "Shuffle," and you would hear the two pitches, 220 Hertz and 440 Hertz, as often as they correspond to the speaking time of women and men, respectively.
- Use Exact Data Values: In this mode, your data is not converted. The gap between sounds exactly matches the respective data value. Note: Negative values cannot be played because there are no negative beat values.
With this module, you can modify and customize your sound using various filters. Depending on the filter you select and the values you set, your sound can become either softer and more mellow or sharper and clearer. Tonal filters work like sieves, selectively allowing certain frequencies of a sound to pass through, depending on the "cutoff frequency" that's set. The "cutoff frequency" determines up to which pitch the frequencies can be heard and which ones get filtered out.
With this module, you can either simply decorate your sound a bit, use a data series to control the "cutoff frequency" or create completely new sounds together with the noise sound.
The module consists of seven input fields:
- Data: In the "Data" field, you can choose which data series will control the cutoff frequency. Initially, only 'Custom' is available as an option. If no data has been loaded yet, the DataSonifyer will use the cutoff frequency entered in "Custom." Once you've successfully loaded data into the DataSonifyer, various columns from your dataset will be available in the 'Data' field.
- Type: Here you can select which filter you want to use. "Off" means that no filter has been selected. A "lowpass filter" is a filter for high frequencies: It filters out all frequencies above the cutoff frequency. The result is a smoother but also duller sound, as the high frequencies are attenuated. A "highpass filter" is the opposite of this: It is a filter for low tones and thus filters out all frequencies below the cutoff frequency. The result is a brighter but sharper sound. A "bandpass filter" is something in between: It allows only frequencies in a preset range around the cutoff frequency to pass through. The result is a defined, focused sound that, depending on the cutoff frequency, can sound like an old telephone.
- Min Cut: In this field, you choose how low the cutoff frequency should be at most. The cutoff frequency is specified in values ranging from a minimum of 20 to 20,000 Hertz. If you've selected a dataset, this minimum cutoff frequency corresponds to the minimum data point ("Min Data").
- Max Cut: In this field, you choose how high the cutoff frequency should be at most. The cutoff frequency is specified in values ranging from a minimum of 20 to 20,000 Hertz. If you've selected a dataset, this maximum cutoff frequency corresponds to the maximum data point ("Max Data").
- Min Data: "Min Data" is the value that corresponds to the lowest cutoff frequency ("Min Cut"). If you've selected a data series under "Data," the lowest value from your chosen data series is displayed here automatically. However, you can also set any value lower than the lowest value in your data series.
- Max Data: "Max Data" is the value that corresponds to the highest cutoff frequency ("Max Cut"). If you've selected a data series under "Data," the highest value from your chosen data series is displayed here automatically. However, you can also set any value higher than the highest value in your data series.
- Custom: If you've chosen "Custom" under "Data," you can select any cutoff frequency between 20 and 20,000 here.
Filtering Noise Sound: If you've selected "Noise" under "Sound," you can best control the noise sound using this module. For instance, by using a Lowpass Filter, you can create sounds resembling wind or ocean waves, depending on the cutoff frequency and envelope settings. With a Highpass Filter and a cutoff frequency set above 15,000, along with an attack envelope of 0.01, you can generate sounds reminiscent of a drum kit's hi-hat.
Note: In this version, only the pitch, the envelope, the amplitude and the rhythm are displayed in the visualisation. Of course, the filters are already audible.
With this module, you can make your sonification more interesting, more lively and more spatial with three different effects. In the "Type" field, you have access to three different effects:
- Reverb: A reverb effect creates a musical hall-like sound, making it seem as if the sound is echoing in a room. Depending on the strength of the effect, the reverberation can be stronger or weaker. A value of 0.0 means no effect, while a value of 1.0 means the effect is at full strength.
- Delay: A delay effect generates an echo of your sound, playing the original sound again but with a slight time delay. Depending on the strength of the effect, the echo can be longer or shorter. A value of 0.0 means no effect, while a value of 1.0 means the effect is at full strength.
- Panning: The panning effect simply controls where your sound should be heard - more on the left ear or more on the right ear. With this effect, you can distribute your sound in the virtual soundscape around you, depending on the value set: 0.0 means all the way to the left, 0.5 is in the middle, and 1.0 is all the way to the right. This can help you differentiate between sounds associated with different categories in your sonification.
- „Send MIDI CC“: With DataSonifyer, you can also control external MIDI devices. Read more about this in the "MIDI" section below. By selecting "Send MIDI CC", you can send values to the so-called "continuous controllers" of your external MIDI device. This effect-type has no effect on the DataSonifyer's own sound in the browser.
Since effects can be somewhat computationally intensive, it's recommended to use them in shorter sonifications. When switching between effects, you might experience some noise in the sonification. In such cases, you can export your work by clicking on "Export Preset," reload the DataSonifyer, and import your work again by clicking on "Import Preset."
In addition to the "Type" field, you have six more fields:
- Data: In the "Data" field, you can choose which data series will control the value of your effect. Initially, only 'Custom' is available as an option. If no data has been loaded yet, the DataSonifyer will use the effect value entered in "Custom." Once you've successfully loaded data into the DataSonifyer, various columns from your dataset will be available in the 'Data' field.
- Min FX: In this field, you choose how weak the effect (for "Delay" and "Reverb") or how far to the left the sound (for "Panning") should be at most. The "Min FX" is specified in values ranging from a minimum of 0.0 to a maximum of 1.0. If you've selected a dataset, this value corresponds to the minimum data point ("Min Data").
- Max FX: In this field, you choose how strong the effect (for "Delay" and "Reverb") or how far to the right the sound (for "Panning") should be at most. The "Max FX" is specified in values ranging from a minimum of 0.0 to a maximum of 1.0. If you've selected a dataset, this value corresponds to the maximum data point ("Max Data").
- Min Data: "Min Data" is the value that corresponds to the lowest effect value ("Min FX"). If you've selected a data series under "Data," the lowest value from your chosen data series is displayed here automatically. However, you can also set any value lower than the lowest value in your data series.
- Max Data: "Max Data" is the value that corresponds to the highest effect value ("Max FX"). If you've selected a data series under "Data," the highest value from your chosen data series is displayed here automatically. However, you can also set any value higher than the highest value in your data series.
- Custom: If you've chosen "Custom" under "Data," you can select any effect value between 0.0 and 1.0 here.
Note: In this version, only the pitch, the envelope, the amplitude and the rhythm are displayed in the visualisation. Of course, the effects are already audible.
You can also control DataSonifyer with MIDI. DataSonifyer listens to "Note On" messages. So whenever you play any note on your MIDI device, the next data point of your sonification is triggered. For example, if you start an arpeggiator or a step sequencer on your MIDI device, the sonification will play in time with the MIDI device.
Vice versa, DataSonifyer can also control MIDI devices and send note values, duration and the velocity of the individual data points to an external MIDI device. This allows you to sonify your data with any sounds and synthesizers.
Switch MIDI on or off here:
MIDI In
Select the MIDI device that DataSonifyer should listen to:
Select the MIDI channel that DataSonifyer should listen to:
MIDI Out
Select the MIDI device to which DataSonifyer should send MIDI messages:
Select the MIDI channel to which DataSonifyer should send MIDI messages:
MIDI CC Out
You can also send values to the MIDI CC ("Continuous Controller") of your device to control individual parameters of your MIDI device (e.g. the cutoff frequency of filters). To do this, activate the effect module under "Add Sound Modules" and select "Send MIDI CC" as "Type". DataSonifyer then sends the values from the effect module to the CC number you have selected. Search for the "MIDI Implementation Chart" of your device to find the correct number:
A little hack: You can activate MIDI In and MIDI Out at the same time. For example, you can control DataSonifyer with a step sequencer via MIDI In and control any synthesizer via MIDI Out to play your sonification on the synthesizer in time. You can also use a digital audio workstation (e.g. Ableton Live: External Instrument) and a virtual MIDI channel (e.g. loopMIDI) for MIDI In and MIDI Out.This gives you endless possibilities to create unique and exciting sounds with your data sets. However, make sure to not send MIDI messages via the same channel (and preferably not via the same MIDI device) that you receive - otherwise you'll have a not so nice audio feedback.
Currently, MIDI-In and MIDI-Out works best with Google Chrome.
🤍 Sonifications to the People 🤍